LOCAL / WIND SEA
Wind waves — formed here
Waves actively driven by the local wind. They tend to be more closely spaced and irregular than swell, giving the surface a choppy texture.
Windy.app · Wave forecast
Waves are crucial for surfing, boating, sailing or even fishing. Let us introduce them in Windy.app.
01 / Wave widget
Significant wave height describes the overall sea state. It is approximately the average crest-to-trough height of the highest third of individual waves.
A forecast of 2 m does not mean every wave is 2 m high. Some are smaller; individual waves can be much larger.
02 / Height & period
An individual wave’s height is the vertical distance from its lowest point (the trough) to its highest point (the crest). It is not just the height above the average sea level. Forecast height summarises a whole field of waves using significant wave height.
The period is the time, in seconds, between successive wave crests passing a fixed point. A 10-second period means about 10 seconds between crests. Mean and peak periods summarise an irregular sea differently; use the period supplied for the selected model and component.
These are offshore wave parameters. The size of waves breaking on a beach also depends on depth, seabed shape, direction and the tide.
03 / Set up Windy.app
Want to see what sits behind the waves in widget or table? Add separate rows for Swell 1, Swell 2 and Wind waves to your Custom profile!
Tap the Setting icon above the forecast table

In Settings, find Profile. Tap CREATE to make your own profile, or select an existing custom profile such as Custom #1.

Scroll below Selected parameters to Available forecast parameters. The wave parameters shown here are available in Easy mode.

Select direction and size, height, and period for each group: Swell 1, Swell 2, and Wind waves. That gives you nine rows. You can also add Wave height and Wave period to compare with the combined sea state.
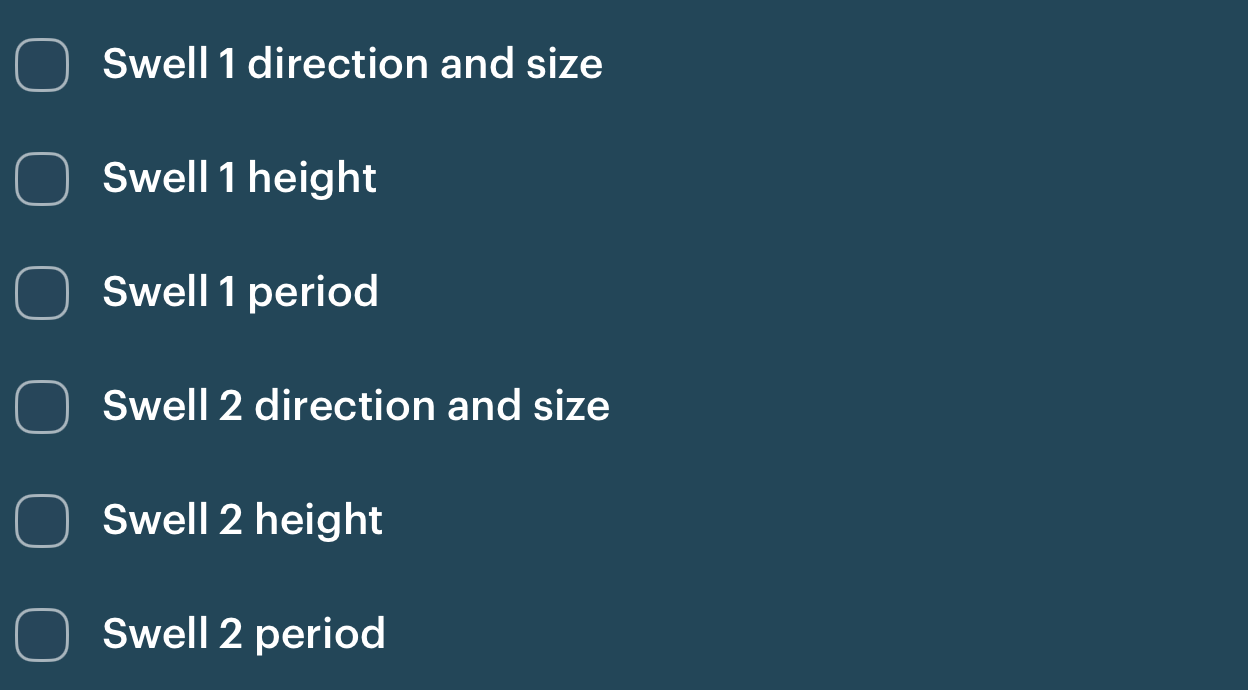

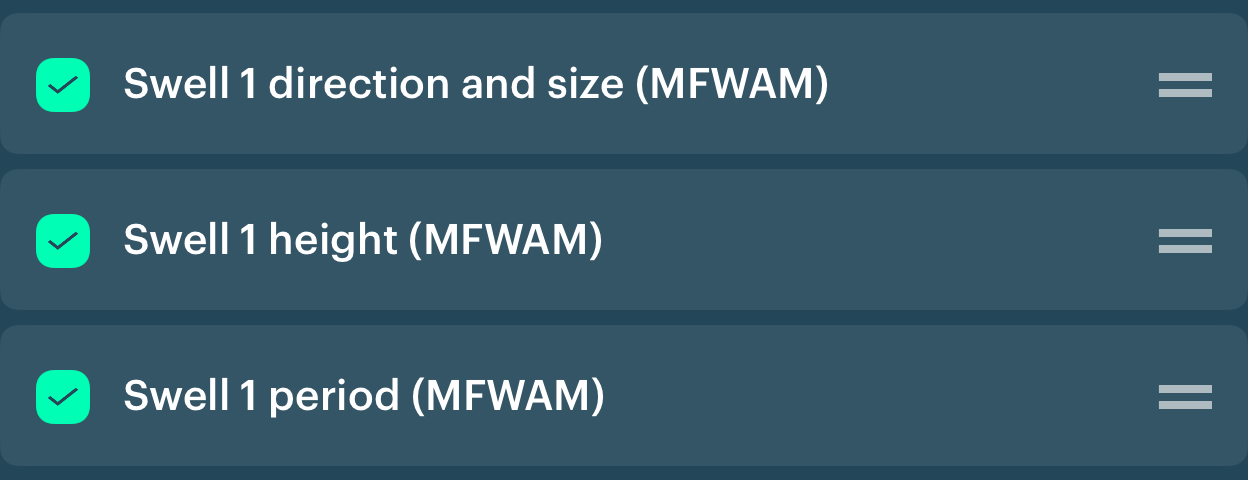
The chosen rows appear under Selected parameters. In this example the component rows use MFWAM. Drag the handles on the right to keep each component’s three rows together.
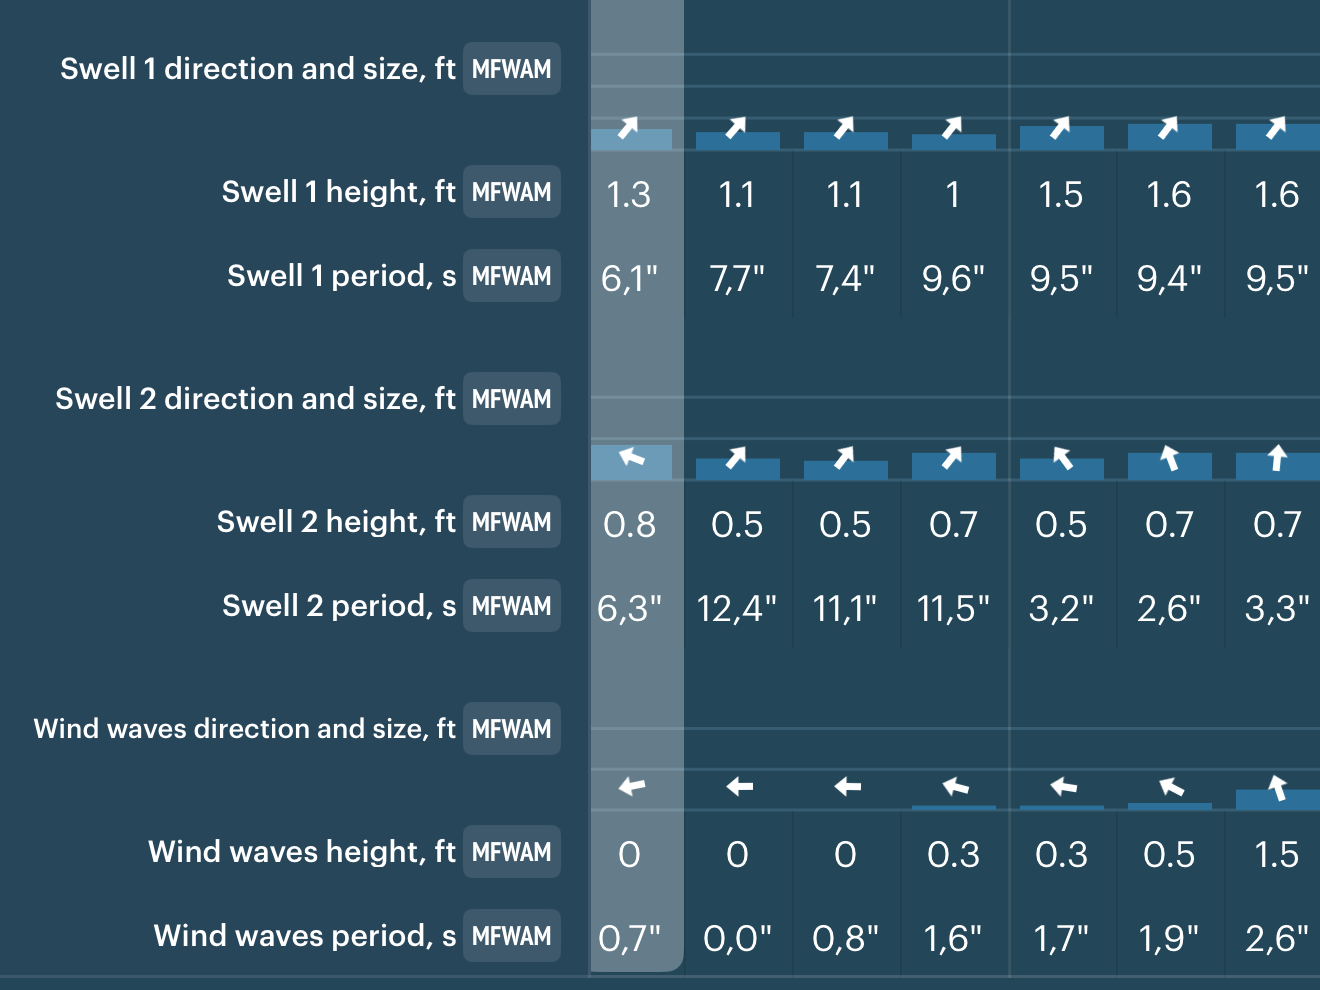
Return to the forecast with your custom profile selected. You will now see each component’s direction, significant height and period separately.
The forecast profile controls which rows you see; it is separate from your account profile. Available parameters and models can vary by location and app version.
04 / Components explained
All these waves began with wind. The distinction is whether the local wind is still driving them, or they are travelling as swell.
Wave models describe the sea as a spectrum of energy across frequencies and directions. They divide that spectrum into wind sea and separate swell systems. Each component has its own significant height, period and direction.
Waves actively driven by the local wind. They tend to be more closely spaced and irregular than swell, giving the surface a choppy texture.
The primary swell system. In forecasts that rank swell by height, this is the largest swell component at that place and time. It often arrives from a distant weather system.
A separate, secondary swell system, potentially with a different period and direction. It can come from another storm or another part of a weather system.
05 / How the total is calculated
Adjust the component heights to see the combined significant wave height. Their energy adds up, so the total is the square root of the sum of their squared heights.
Move the sliders. All heights are in metres.
This demo combines three components. A model may contain more swell partitions; include all of them to reconstruct the total. Rounded or incomplete forecast values may not reproduce the displayed total exactly. If Swell 2 exceeds Swell 1 here, the demo keeps your labels; a height-ranked forecast would reorder them.
Spectral wave models calculate Hm0 = 4√m0, where m0 is the sea-surface elevation variance obtained from the wave spectrum. Variances add across non-overlapping spectral partitions. Because H² = 16m0, the squared component heights also add. Hm0 is close to the highest-third measure H1/3.